
When Short Term Yields Beat Long Term Yields, Pay Attention
Heard that some bond-market squiggle supposedly predicts recessions, and wondering if you should care? Here's the inverted yield curve in plain English — including the recent time it cried wolf.
This little line has one of the best forecasting records in economics.
It also just gave its loudest warning ever... and the recession never showed up.
Both halves of that story matter, so let's take them in order.
1. Learn What the Yield Curve Is
When you buy a U.S. Treasury bond, you're lending money to the government, and the yield is the interest rate it pays you.
The yield curve is just a line connecting those rates for different loan lengths — a few months, 2 years, 10 years, 30 years.
Normally the line slopes up: locking your money away for 10 years pays more than 2, the same way you'd charge a friend more to borrow your cash for a decade than for a weekend.
Investors watch one pair above all: the 2-year yield versus the 10-year yield.
How to See It:
- The FRED 10-2 chart — the St. Louis Fed's free graph of the gap between 10-year and 2-year yields, going back decades.
- Our guide to stocks versus bonds — if bonds are new to you, start here.

- An NPR Planet Money host tells how money was invented — and reinvented
- From goldsmiths' receipts to central banks to crypto, minus the textbook tone
- Short, funny chapters that make monetary history stick
2. Spot an Inversion
An inversion is the curve flipping upside down: short-term loans suddenly pay more than long-term ones.
That's as odd as a weekend loan costing more than a ten-year one — so why does it happen?
Two forces squeeze the curve: the Federal Reserve pushes short-term rates up to fight inflation, while investors — expecting those high rates to choke the economy — pile into long-term bonds, which pushes long-term yields down.
An inverted curve is really a prediction wearing a costume: the bond market betting that growth will slow and the Fed will have to cut rates later.
How to Check It:
- On that same FRED chart, an inversion is simply the line dipping below zero — no math required.
3. Respect Its Track Record
Why does anyone care about a squiggle? Because for over half a century, essentially every U.S. recession was preceded by an inversion.
The curve flipped in 2000 before the dot-com bust, in 2006 before the 2008 financial crisis, and in 2019 before the 2020 downturn.
The lag varies a lot — anywhere from a few months to about two years — so it's a storm warning, not an appointment.
And remember: the inversion doesn't cause the recession, any more than a smoke alarm causes fires.
How to Check It:
- The New York Fed's recession-probability page — the official model that turns the curve into recession odds, updated monthly.
4. Study the Record-Breaking 2022 Inversion
Then came the big one.
In 2022, inflation hit 9.1% — the worst in four decades — and the Fed raised its benchmark rate from near zero to above 5% in barely a year and a half, one of the fastest hiking sprees in its history.
Short-term yields rocketed, long-term yields lagged, and in July 2022 the 2-year flipped above the 10-year.
By July 2023 the gap passed a full percentage point — the deepest inversion since 1981 — and the curve stayed inverted for more than two years, the longest stretch on record, before flipping back to normal around September 2024 as the Fed began cutting.
Economists braced for impact, and headlines counted down to a recession. And then...
How to Check It:
- Zoom the FRED chart to 2022–2024 and you can see the whole saga — the plunge below zero, the record depth, and the climb back out.
5. Notice What Didn't Happen
No recession came.
Through mid-2026, the U.S. economy kept growing — the loudest recession alarm in modern history turned out to be the signal's biggest false alarm so far.
Why? Economists point to post-pandemic weirdness: massive government spending still working through the economy, plus households and companies that had locked in cheap fixed-rate debt, making them unusually numb to the Fed's rate hikes.
There's a humbling pattern here too: in past cycles, even the curve flipping back to normal often arrived just before the downturn finally hit — and this time that follow-up warning fizzled as well. So much for "every time"!
The lesson isn't that the curve is useless; it's that no single indicator is destiny.
How to Think About It:
- Treat the curve as one gauge on the dashboard, alongside jobs numbers, spending data, and inflation.
- Be extra skeptical of anyone who says any one chart makes recessions "guaranteed."
6. Check the Curve Today
As of late August 2026, the curve is back to normal, with the 10-year yield sitting roughly half a percentage point above the 2-year.
A steepening curve like today's usually signals that investors expect decent growth — or stickier inflation — down the road.
For your wallet, the curve still matters day to day: long-term rates steer mortgages, while short-term rates steer savings yields and credit cards.
But if the signal flashes again someday, you'll know the drill: pay attention, don't panic, and don't bet the house on any one squiggle.
How to Follow It:
- The U.S. Treasury's daily rates page — the official source, updated every trading day.
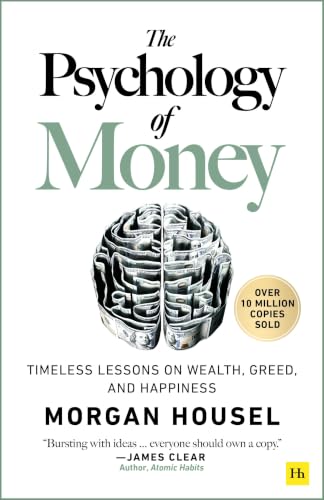
- 19 short stories on how emotions, ego, and luck drive money decisions
- Shows why staying wealthy is a different skill than getting wealthy
- The rare finance book about behavior, not formulas
Wrapping Up
The yield curve is the bond market's weather forecast: right often enough to respect, wrong recently enough to keep you humble.
Watch it, learn from it, but never hand any single signal the keys to your plan.
These are ideas to chew on, not personal instructions or individualized financial advice — your money, your call.
13 Market Signals Worth Keeping on Your Radar
Interest Rate and Yield Are Not the Same Thing